Understanding the Basics of Data Analysis
Understanding the Basics of Data Analysis Data analysis might sound like a complex concept, but it’s really all about making sense of numbers and patterns. Let’s dive into the essentials that can help you get started.
- What is Data Analysis? At its core, data analysis is the process of inspecting, cleaning, and modeling data to discover useful information. It’s like being a detective—finding clues in the numbers to solve a mystery or make informed decisions.
- Types of Data There are two main types of data you’ll encounter: qualitative and quantitative.
- Qualitative Data: This is descriptive data, like colors, names, or feelings. It helps you understand the 'why' behind the numbers.
- Quantitative Data: This is numerical data, which can be measured and analyzed statistically. Think of sales figures or website traffic numbers.
- Basic Statistical Concepts Statistics is the backbone of data analysis. Here are a few key terms:
- Mean: The average value.
- Median: The middle value when data is sorted.
- Mode: The value that appears most frequently.
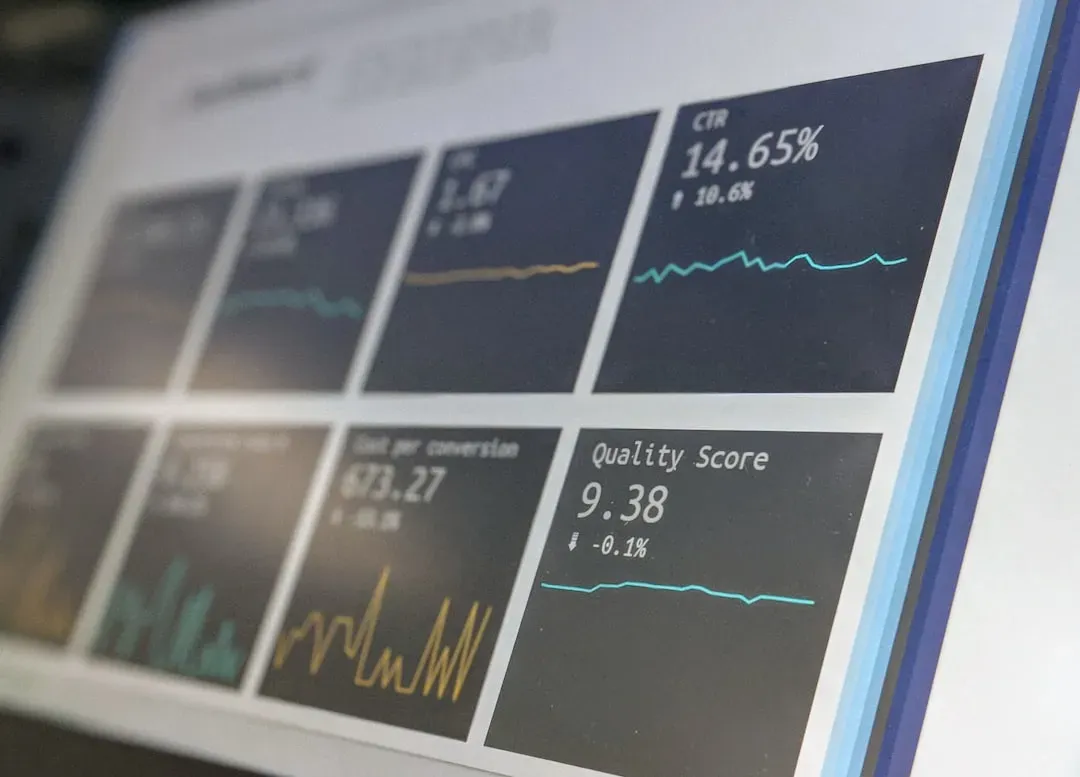
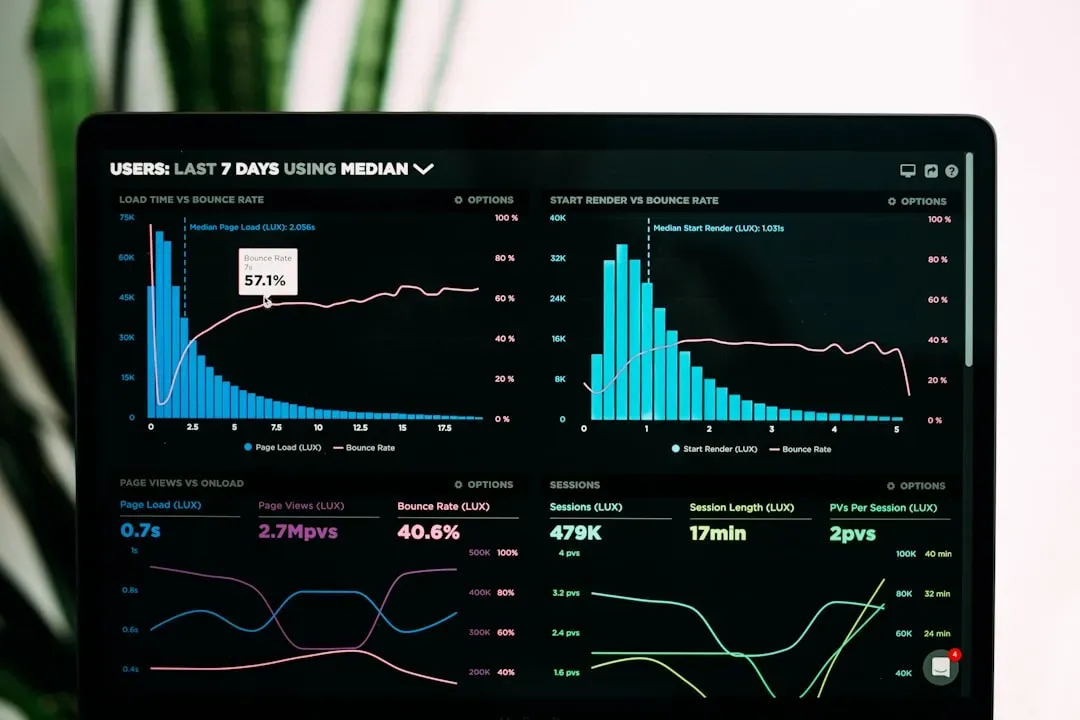
- Data Visualization Turning data into visuals is crucial. Charts, graphs, and dashboards can help you spot trends and patterns at a glance. Remember, a picture is worth a thousand words!
- Tools for Data Analysis Various tools can assist in analyzing data, from Excel to more advanced software like R or Python. Each tool has its strengths, so choose one that fits your needs.
- Interpreting Results Once you have your analysis, the real work begins. You need to interpret the results and communicate them clearly. Asking questions like “What does this data tell us?” can guide decision-making.
Key Statistical Terms You Should Know
When it comes to data analysis, knowing your statistical terms is essential. Let’s break down some key statistical concepts that will make your data journey smoother.
- Population vs. Sample: The population is the entire group you want to study, while a sample is a smaller, manageable subset of that population. Think of it as a taste test—sampling helps you make conclusions without needing to analyze everything.
- Standard Deviation: This term measures how spread out the numbers in your data set are. A low standard deviation means your data points are close to the mean, while a high standard deviation indicates a wide range of values. It’s like gauging how much your friends’ heights vary from the average height!
- Variance: Closely related to standard deviation, variance quantifies the degree of spread in your data set. It’s calculated by averaging the squared differences from the mean. If you want to dig deeper into how spread out your data is, variance is your go-to term.
- Correlation: This term assesses the relationship between two variables. If they move together, they are positively correlated; if one increases while the other decreases, that's a negative correlation. However, correlation doesn’t imply causation, so be cautious when drawing conclusions!
- P-Value: In hypothesis testing, the p-value helps you determine the significance of your results. A low p-value (typically less than 0.05) indicates strong evidence against the null hypothesis, suggesting that your results are statistically significant.
- Confidence Interval: This is a range of values that likely contains the true population parameter. It’s a way to express uncertainty in your estimates—think of it as your safety net when making predictions based on your sample data.
The Role of Data Visualization in Analysis
Data visualization plays a crucial role in analysis, transforming complex data sets into understandable visuals that tell a story. It’s like taking a dense book and turning it into an engaging comic strip—much easier to digest, right? Let’s explore why data visualization is a game-changer in the world of data analysis.
- Simplifying Complexity: Data can be overwhelming, especially when it’s packed with numbers and statistics. Visualization helps simplify this complexity by presenting data in a more accessible format. Charts, graphs, and maps can quickly reveal trends and patterns that might be lost in a sea of numbers.
- Enhanced Insights: Visuals allow analysts to see relationships and correlations at a glance. For example, a scatter plot can instantly show how two variables interact. This immediate insight can lead to faster decision-making and more accurate predictions.
- Engagement and Retention: People are generally more engaged with visuals than with raw data. Infographics, for instance, can convey information in a way that’s not only informative but also captivating. This boosts retention, making it likely that your audience will remember the key takeaways.
- Storytelling: Visualization is a powerful tool for storytelling. By using visuals, analysts can create a narrative around the data, guiding the audience through the findings step by step. This narrative structure helps contextualize the data and makes it more relatable.
- Facilitating Collaboration: When working in teams, sharing data insights visually can promote better collaboration. Everyone can interpret the same visuals in real-time, leading to more productive discussions and brainstorming sessions.
Real-World Applications of Data Analysis Concepts
Data analysis concepts are everywhere in the real world, and their applications are fascinating. Whether in business, healthcare, or environmental science, data analysis shapes decisions and strategies. Let’s dive into how these concepts are applied practically, making a big difference in various fields.
- Business Intelligence: Companies use data analysis to understand customer behavior and market trends. By analyzing sales data, businesses can identify which products are flying off the shelves and which ones need a boost. This insight helps them tailor marketing strategies, optimize inventory, and ultimately increase profits.
- Healthcare Analytics: In healthcare, data analysis is a game-changer. Hospitals analyze patient data to improve care delivery and reduce costs. For instance, predictive analytics can forecast patient admissions, helping hospitals manage staffing and resources more effectively. This not only enhances patient care but also streamlines operations.
- Environmental Monitoring: Data analysis plays a pivotal role in understanding climate change and environmental issues. Scientists collect vast amounts of data on temperature, pollution, and wildlife patterns. By analyzing this data, they can model environmental changes and develop strategies to combat issues like deforestation or habitat loss.
- Sports Analytics: Athletes and teams increasingly rely on data analysis to gain a competitive edge. Coaches analyze players' performance metrics to develop training programs tailored to individual strengths and weaknesses. This data-driven approach can lead to improved performance and smarter game strategies.
- Smart Cities: Urban planners utilize data analysis to create smarter cities. By analyzing traffic patterns, energy consumption, and public transport usage, they can optimize infrastructure and services. This leads to improved quality of life for residents and more efficient use of resources.
What tools do I need for data analysis?
When you're diving into data analysis, having the right tools can make all the difference. Let’s break down the essentials you’ll need to get started, making it easier for you to navigate through the world of data.
- Spreadsheet Software: Programs like Microsoft Excel or Google Sheets are fundamental. They’re user-friendly and great for basic data manipulation, calculations, and visualizations. You can easily create charts, graphs, and pivot tables to summarize your findings.
- Statistical Software: For more advanced analysis, tools like R and Python come into play. R is fantastic for statistical analysis, while Python offers versatility with libraries like Pandas and NumPy. These tools allow you to perform complex analyses and visualize your data effectively.
- Data Visualization Tools: Once you’ve got your data analyzed, it’s time to present it beautifully. Tools like Tableau and Power BI let you create stunning dashboards. Visualizations help stakeholders grasp insights quickly, making it easier to tell your data story.
- Database Management Systems: If you’re working with large datasets, knowledge of SQL (Structured Query Language) is crucial. Tools like MySQL or PostgreSQL help you manage and query your data efficiently, ensuring quick access to the information you need.
- Cloud Computing Services: Platforms like Google Cloud or AWS provide powerful resources for data storage and processing. They allow you to handle big data without worrying about hardware limitations. Plus, they often come with built-in tools for machine learning and analytics.
- Project Management Tools: Keeping your data projects organized is key. Tools like Trello or Asana help you manage tasks, deadlines, and collaboration efforts. They ensure that everyone on your team is on the same page and that projects move smoothly.
How can data analysis improve decision-making?
When you're diving into data analysis, having the right tools can make all the difference. Let’s break down the essentials you’ll need to get started, making it easier for you to navigate through the world of data.
- Spreadsheet Software: Programs like Microsoft Excel or Google Sheets are fundamental. They’re user-friendly and great for basic data manipulation, calculations, and visualizations. You can easily create charts, graphs, and pivot tables to summarize your findings.
- Statistical Software: For more advanced analysis, tools like R and Python come into play. R is fantastic for statistical analysis, while Python offers versatility with libraries like Pandas and NumPy. These tools allow you to perform complex analyses and visualize your data effectively.
- Data Visualization Tools: Once you’ve got your data analyzed, it’s time to present it beautifully. Tools like Tableau and Power BI let you create stunning dashboards. Visualizations help stakeholders grasp insights quickly, making it easier to tell your data story.
- Database Management Systems: If you’re working with large datasets, knowledge of SQL (Structured Query Language) is crucial. Tools like MySQL or PostgreSQL help you manage and query your data efficiently, ensuring quick access to the information you need.
- Cloud Computing Services: Platforms like Google Cloud or AWS provide powerful resources for data storage and processing. They allow you to handle big data without worrying about hardware limitations. Plus, they often come with built-in tools for machine learning and analytics.
- Project Management Tools: Keeping your data projects organized is key. Tools like Trello or Asana help you manage tasks, deadlines, and collaboration efforts. They ensure that everyone on your team is on the same page and that projects move smoothly.
In summary, understanding data analysis concepts is more than just a skill—it's a superpower that can transform how you interpret the world around you. From grasping the basics of qualitative and quantitative data to mastering essential statistical terms and the art of data visualization, each element plays a crucial role in uncovering insights that drive effective decision-making. The real-world applications of these concepts, whether in business, healthcare, or environmental science, showcase their significance in making informed choices that impact lives. With the right tools and knowledge, you can navigate the complexities of data and turn raw numbers into compelling narratives. So, whether you're looking to advance your career or simply satisfy your curiosity, keep exploring the exciting realm of data analysis. Embrace the journey, and let the power of data guide you in making smarter decisions every day!