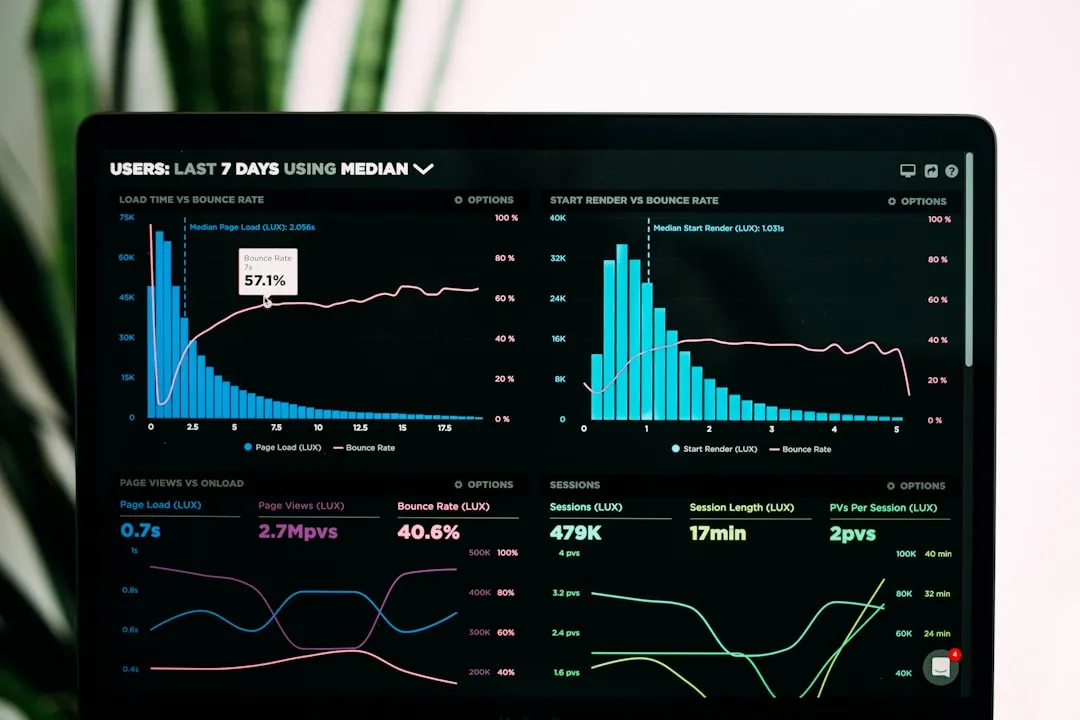
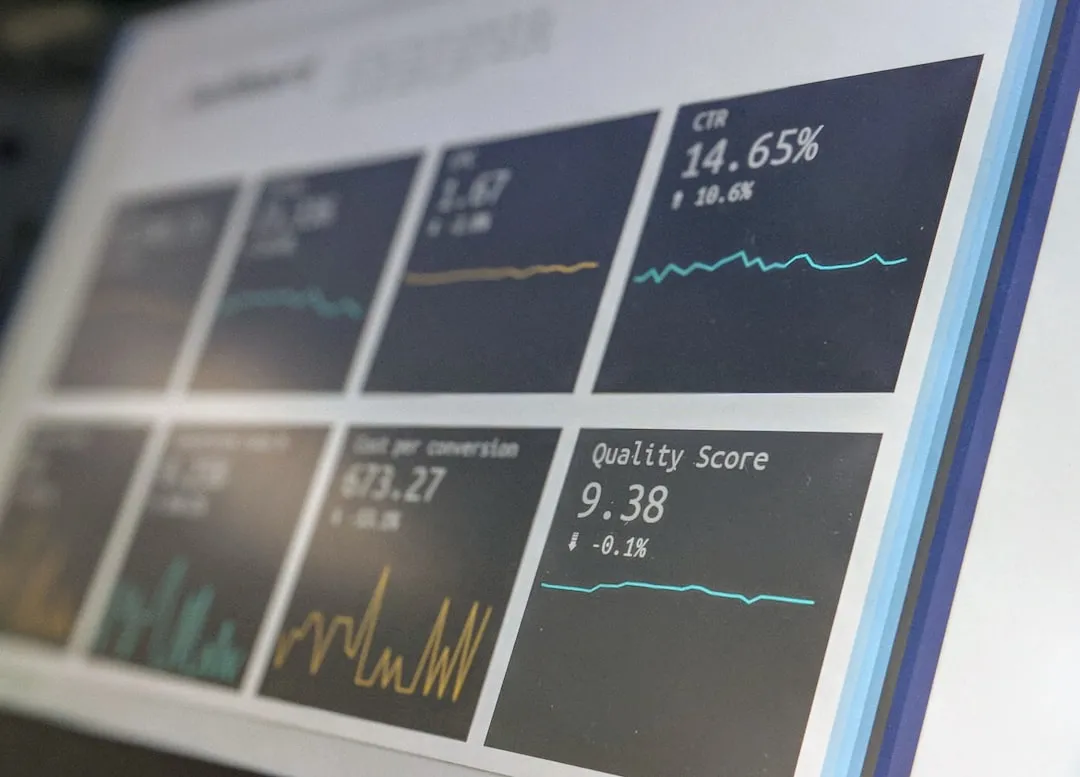
Hey there! Have you ever wondered how businesses make sense of the vast amounts of data they collect every day? Welcome to the fascinating world of data analysis techniques! Whether you’re a curious beginner or a seasoned pro looking to brush up on your skills, understanding the fundamentals of data analysis is crucial in today’s data-driven landscape. From identifying trends to making informed decisions, these techniques can be game-changers for anyone wanting to dive into the numbers. So, what exactly are these techniques, and how can they help you? In this article, we’ll explore various methods, break them down into bite-sized pieces, and show you how to apply them in real-life scenarios. Ready to unlock the secrets of data analysis? Let’s get started!
Understanding the Basics of Data Analysis Techniques
When it comes to data analysis, there are a few key techniques that can really make a difference in how you interpret the information at hand. Let’s dive right into some of the basics that can elevate your data game!
- Descriptive Analysis: This technique is all about summarizing the main features of a dataset. It helps you understand what has happened in the past by using measures like mean, median, and mode. Think of it as your data's report card, showcasing trends and patterns without getting too complicated.
- Diagnostic Analysis: After you know what happened, it’s time to ask why. Diagnostic analysis digs deeper to uncover the reasons behind trends or anomalies. This can involve comparing different datasets or using correlation analysis to see how variables interact. It’s like being a detective, piecing together clues to explain the data story.
- Predictive Analysis: This is where things get exciting! Predictive analysis uses historical data to forecast future trends. Techniques like regression analysis and machine learning models fall under this category. Imagine trying to predict next quarter's sales based on past performance—this is the magic of predictive analysis.
- Prescriptive Analysis: Now that you can predict what might happen, prescriptive analysis takes it a step further by suggesting actions. This technique often employs optimization and simulation algorithms. It’s like having a personal advisor that recommends the best course of action based on your data.
- Exploratory Data Analysis (EDA): EDA is all about exploring datasets to find hidden patterns or insights before diving deeper into analysis. It often involves visual techniques like plots and charts. Think of it as your data treasure hunt—who knows what surprises you’ll uncover!
Transitioning between these techniques can enhance your understanding and application of data analysis. For instance, you might start with EDA to visualize your data, then move to descriptive and diagnostic analysis to summarize and understand it better. From there, you can shift to predictive and prescriptive analysis to make informed decisions and optimize strategies.
In a nutshell, mastering these data analysis techniques is essential for anyone looking to leverage data effectively. Whether you're in business, marketing, or even just curious about data, these skills can empower you to make smarter decisions and uncover valuable insights. So, ready to take your first step into the world of data analysis? Happy analyzing!
Exploring Descriptive Analysis and Its Importance
When it comes to data analysis, there are a few key techniques that can really make a difference in how you interpret the information at hand. Let’s dive right into some of the basics that can elevate your data game!
- Descriptive Analysis: This technique is all about summarizing the main features of a dataset. It helps you understand past events using metrics like mean, median, and mode. Think of it as your data's report card, showcasing trends and patterns without overcomplicating things.
- Diagnostic Analysis: After identifying what happened, it’s time to explore the reasons behind it. Diagnostic analysis digs deeper to uncover the causes of trends or anomalies. This often involves comparing datasets or utilizing correlation analysis to see how variables interact. It’s like being a detective, piecing together clues to tell the data story.
- Predictive Analysis: Here’s where the excitement begins! Predictive analysis leverages historical data to forecast future trends. Techniques such as regression analysis and machine learning models fall into this category. Imagine trying to predict next quarter's sales based on previous performance—this is the magic of predictive analysis.
- Prescriptive Analysis: Once you can predict future events, prescriptive analysis takes it a step further by recommending actions. This technique often uses optimization and simulation algorithms. It’s like having a personal advisor suggesting the best course of action based on your data.
- Exploratory Data Analysis (EDA): EDA focuses on uncovering hidden patterns or insights within datasets before delving deeper. It often employs visual techniques like plots and charts. Think of it as a treasure hunt for data—who knows what gems you might find!
Transitioning between these techniques enhances your understanding and application of data analysis. For instance, you might start with EDA to visualize your data, then move to descriptive and diagnostic analysis for summarization. From there, you can shift to predictive and prescriptive analysis to make informed decisions and optimize strategies.
In a nutshell, mastering these data analysis techniques is crucial for anyone looking to leverage data effectively. Whether you’re in business, marketing, or simply curious about data, these skills empower you to make smarter decisions and uncover valuable insights. So, ready to take your first step into the world of data analysis? Happy analyzing!
Diving into Predictive Analysis for Future Insights
When it comes to diving into predictive analysis, it’s like entering a whole new realm of possibilities with your data. Let’s break it down and see why it’s such a game-changer for gaining insights about the future!
First off, predictive analysis isn’t just about making wild guesses. It’s grounded in solid historical data, helping you foresee trends and patterns that can impact your decisions. Here’s what makes it stand out:
- Data-Driven Decisions: Predictive analysis allows you to base your decisions on data rather than gut feelings. By examining past behaviors and outcomes, you can make informed predictions about what’s likely to happen next.
- Techniques Galore: There are various methods you can use, from regression analysis to machine learning algorithms. These techniques can analyze complex data sets and identify relationships you might not see at first glance.
- Risk Management: One of the biggest perks of predictive analysis is its ability to identify risks before they materialize. By understanding potential pitfalls, you can devise strategies to mitigate them, making your operations smoother.
- Enhanced Customer Insights: Businesses can use predictive analysis to understand customer behaviors, preferences, and trends. This means you can tailor your marketing efforts more effectively, leading to higher engagement and conversion rates.
- Resource Optimization: Knowing what’s likely to happen allows for better resource allocation. Whether it’s staffing, inventory, or budget, predictive insights help you use your resources wisely, saving both time and money.
Transitioning from basic analysis techniques to predictive analysis can feel like leveling up in a video game. You start with descriptive and diagnostic analysis to grasp what has happened, and then shift gears to predictive models that forecast future scenarios.
In essence, predictive analysis is about preparing for what’s next. By harnessing the power of your data, you can uncover valuable insights that drive strategic decisions. So, if you’re looking to boost your data strategy, embracing predictive analysis is a smart move. Get ready to uncover the future—your data is waiting to tell its story! Happy predicting!
Using Prescriptive Analysis to Drive Decisions
When you think about prescriptive analysis, it’s like having a crystal ball that not only tells you what might happen but also suggests the best course of action. It’s the next step after predictive analysis, where you take those forecasts and turn them into actionable insights. Let’s dive into the nitty-gritty of how prescriptive analysis can turbocharge your decision-making.
First, let’s clarify what prescriptive analysis does. It goes beyond just predicting outcomes; it offers recommendations based on those predictions. Here’s why it’s essential for any data-driven strategy:
- Actionable Insights: Instead of just knowing what might happen, prescriptive analysis tells you what to do about it. This means you can make decisions with confidence, knowing you have a data-backed plan in place.
- Scenario Planning: Want to weigh different options? Prescriptive analysis allows you to simulate various scenarios. You can see how changes in strategy might affect outcomes, helping you choose the best path.
- Resource Allocation: Just like predictive analysis, prescriptive analysis helps optimize resources. By understanding the best ways to allocate time, money, and personnel, you can maximize efficiency and minimize waste.
- Real-Time Recommendations: With advancements in technology, prescriptive analysis can provide real-time insights. Imagine receiving suggestions while making decisions—this can drastically improve responsiveness and adaptability.
- Enhanced Risk Management: Prescriptive analysis identifies risks and suggests preventative measures. This proactive approach helps in avoiding pitfalls before they arise, ensuring smoother operations.
Transitioning to prescriptive analysis can feel like unlocking a new level in your data strategy. Once you’ve leveraged predictive insights, you can dive deeper into what those insights mean for your business.
In summary, prescriptive analysis empowers you to not only anticipate future scenarios but also take decisive action based on those predictions. By utilizing this powerful tool, you can elevate your decision-making process and steer your organization toward success. So, if you're ready to transform your data into a roadmap for the future, embracing prescriptive analysis is where you need to be. Let the recommendations roll in—your decisions just got a serious upgrade!
What are the best tools for data analysis techniques?
When diving into data analysis, it’s crucial to have the right tools in your toolkit. The variety of options available can be overwhelming, but let’s break it down into some of the best tools that make data analysis a breeze.
- Excel: A classic choice, Excel is versatile for basic data analysis. Its functions, pivot tables, and charts allow you to manipulate and visualize data effectively. Plus, everyone knows it!
- Tableau: This is a powerhouse for data visualization. Tableau helps you create stunning, interactive dashboards that make data storytelling a walk in the park. It’s perfect for presenting data to stakeholders who prefer visuals over spreadsheets.
- Python and R: If you’re looking for deeper analysis, these programming languages are your best friends. Python, with libraries like Pandas and NumPy, and R, designed specifically for statistics, offer powerful tools for data manipulation and analysis. They’re great for running complex algorithms and creating predictive models.
- Google Analytics: For web data analysis, Google Analytics is indispensable. It provides insights into user behavior, traffic sources, and conversion metrics, helping you optimize your digital presence.
- SAS: This tool is widely used in advanced analytics, business intelligence, and data management. SAS is robust for statistical analysis, making it a popular choice in industries like healthcare and finance.
- Power BI: Microsoft’s Power BI integrates seamlessly with other Microsoft products and is fantastic for creating reports and dashboards. It’s user-friendly and ideal for businesses already using the Microsoft ecosystem.
Transitioning between these tools can be seamless, depending on your needs. For instance, you might start with Excel for data cleaning, then move to Tableau for visualization, and use Python for advanced analytics.
Ultimately, the best tool for data analysis depends on your specific goals and the complexity of your data. By leveraging these tools effectively, you can turn raw data into meaningful insights, enhancing your decision-making process. So, whether you’re a newbie or a seasoned analyst, having the right tools at your disposal can truly elevate your data game!
How do I choose the right data analysis technique for my project?
When diving into data analysis, it’s crucial to have the right tools in your toolkit. The variety of options available can be overwhelming, but let’s break it down into some of the best tools that make data analysis a breeze.
- Excel: A classic choice, Excel is versatile for basic data analysis. Its functions, pivot tables, and charts allow you to manipulate and visualize data effectively. Plus, everyone knows it!
- Tableau: This is a powerhouse for data visualization. Tableau helps you create stunning, interactive dashboards that make data storytelling a walk in the park. It’s perfect for presenting data to stakeholders who prefer visuals over spreadsheets.
- Python and R: If you’re looking for deeper analysis, these programming languages are your best friends. Python, with libraries like Pandas and NumPy, and R, designed specifically for statistics, offer powerful tools for data manipulation and analysis. They’re great for running complex algorithms and creating predictive models.
- Google Analytics: For web data analysis, Google Analytics is indispensable. It provides insights into user behavior, traffic sources, and conversion metrics, helping you optimize your digital presence.
- SAS: This tool is widely used in advanced analytics, business intelligence, and data management. SAS is robust for statistical analysis, making it a popular choice in industries like healthcare and finance.
- Power BI: Microsoft’s Power BI integrates seamlessly with other Microsoft products and is fantastic for creating reports and dashboards. It’s user-friendly and ideal for businesses already using the Microsoft ecosystem.
Transitioning between these tools can be seamless, depending on your needs. For instance, you might start with Excel for data cleaning, then move to Tableau for visualization, and use Python for advanced analytics.
Ultimately, the best tool for data analysis depends on your specific goals and the complexity of your data. By leveraging these tools effectively, you can turn raw data into meaningful insights, enhancing your decision-making process. So, whether you’re a newbie or a seasoned analyst, having the right tools at your disposal can truly elevate your data game!
In summary, don’t hesitate to experiment with different tools and see what fits best for your project. Each tool has its strengths, and finding the right combination can lead to success in your data analysis endeavors. Happy analyzing!
In conclusion, mastering data analysis techniques is essential for anyone looking to make sense of the ever-growing amounts of data around us. From the basics of descriptive and diagnostic analysis that help summarize past events to the exciting realm of predictive and prescriptive analysis that forecast future scenarios and suggest actionable steps, each technique plays a vital role. Exploring these methods empowers you to uncover valuable insights and drive smarter decision-making. Additionally, leveraging the right tools, whether it’s Excel for basic tasks or Python for more complex analyses, can significantly enhance your data journey. Remember, the key is to experiment and find what works best for your specific needs. So, whether you're just starting or looking to refine your skills, embrace the world of data analysis and let your data tell its story! Happy analyzing!
