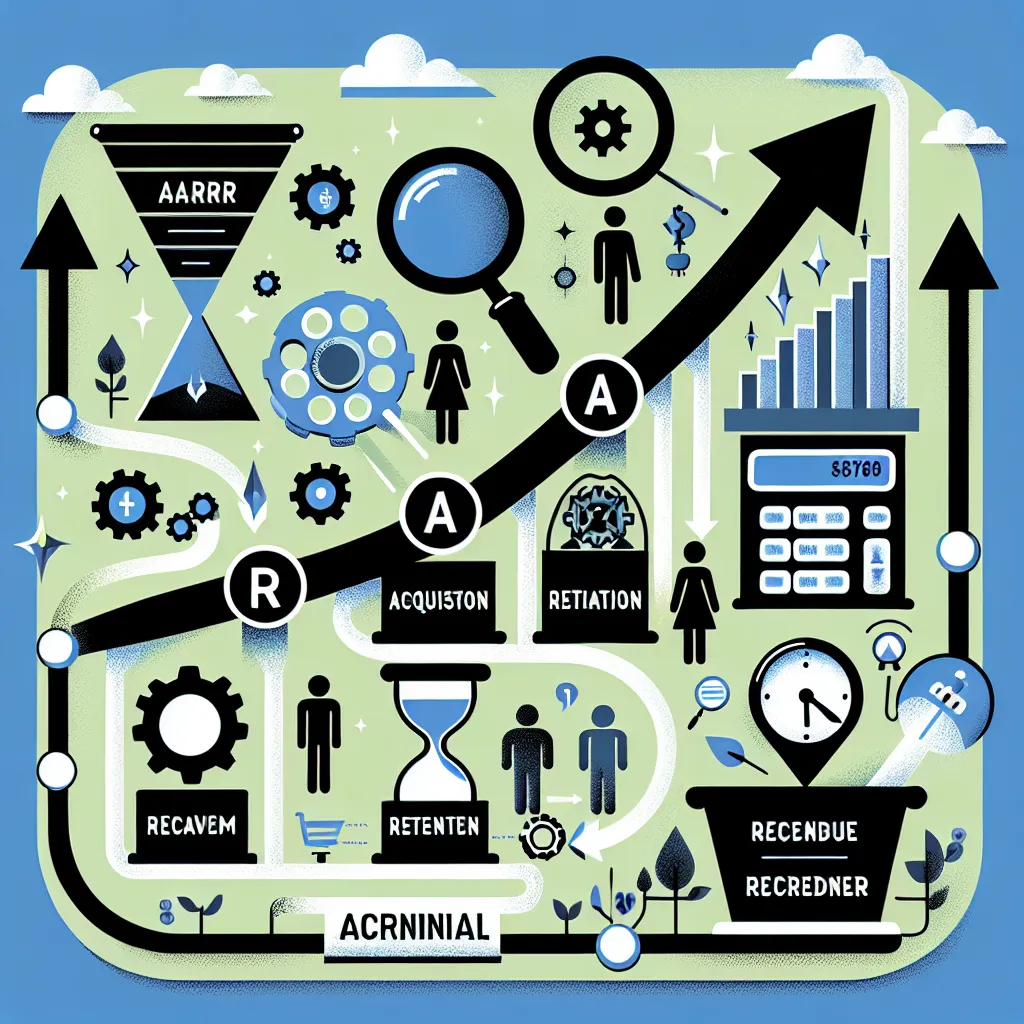
My Journey with the AARRR Framework for Business Growth
Analytics · 18 Nov 2024
Join me as I share my journey with the AARRR framework for business growth and discover how this simple model transformed my approach to success and engagement.

AARRR framework explained: Use Pirate Metrics to grow products by optimizing Acquisition, Activation, Retention, Revenue, and Referral.
analytics · 07 Nov 2025
The AARRR framework is a simple, five-stage model—Acquisition, Activation, Retention, Revenue, Referral—that helps you measure and grow product traction quickly.
This matters because it turns vague growth goals into concrete metrics you can track, test, and improve, especially when resources are limited. In this guide you'll learn how I apply the AARRR framework to real products, set measurable KPIs, run tests with data tools like SQL and Python, and use insights to prioritize growth work. Expect practical examples, a mini case study, and action templates you can copy into your analytics stack.
What channels drive your first touchpoints? Acquisition answers that question by tracking how users arrive—organic search, paid ads, referrals, content, or partners. You should segment channels and measure cost and conversion rates per channel so you know where to invest.
Example: a SaaS startup saw 40% higher activation from organic blog traffic than paid search despite 3x lower visits, so they reallocated budget towards content and technical SEO.
| Channel | Visits | Activation Rate | Cost | Cost/Activated User |
|---|---|---|---|---|
| Organic | 12,000 | 8.0% | $500 | $0.52 |
| Paid Search | 9,000 | 3.0% | $4,000 | $14.81 |
| Referral | 3,000 | 10.0% | $200 | $0.67 |
| Social | 5,000 | 2.5% | $600 | $12.00 |
| Partners | 1,200 | 12.0% | $100 | $0.69 |
Quick checklist to improve Acquisition:
How do you know a user had a “moment of value”? Activation defines that milestone—first successful task, completed onboarding, or Aha! moment. You must define one activation event per user type, instrument it, and measure time-to-activation.
Common activation metrics: time-to-first-task, percent completing onboarding, and feature adoption within first 7 days. In one case study, improving the onboarding checklist lifted activation from 18% to 36% in eight weeks by reducing steps and surfacing contextual tooltips.
| Cohort | Users | Activated (%) | Median Time-to-Activate | Top Barrier |
|---|---|---|---|---|
| Organic Jan | 1,500 | 28% | 2 days | Confusing setup |
| Paid Feb | 900 | 15% | 4 days | Missing guidance |
| Referral Mar | 400 | 42% | 1 day | Clear intent |
| Social Apr | 700 | 12% | 5 days | Low intent |
| Partner May | 250 | 48% | 12 hours | Pre-qualified users |
Actionable test idea: reduce onboarding steps by 30%, instrument events for each step, and run an A/B test to measure activation uplift and downstream retention.
Retention measures whether users continue to find value after activation—it's the backbone of sustainable growth. You should track retention curves, churn rate, and engagement depth (sessions per week, feature frequency).
Ask: which features create habit? Use event sequences to identify loops that predict long-term retention. For example, a marketplace product discovered that sending personalized reminders on day 3 doubled 30-day retention for a high-value cohort.
| Cohort Start | Day 7 Retention | Day 30 Retention | Monthly Churn | Key Driver |
|---|---|---|---|---|
| Jan | 35% | 22% | 18% | Onboarding quality |
| Feb | 30% | 20% | 19% | Feature discoverability |
| Mar | 42% | 30% | 13% | Personalized tips |
| Apr | 25% | 15% | 25% | Low engagement |
| May | 48% | 34% | 11% | Partner onboarding |
Retention playbook: identify high-value actions, instrument them, and automate tailored nudges (email, push) for users who skip those actions within a specific time window.
Revenue and Referral are the business outcomes of steady Acquisition, Activation, and Retention work. Revenue tracks how users convert to paid tiers and their lifetime value (LTV). Referral measures how many users bring others—word of mouth amplified by referral incentives.
Measure conversion funnels, average revenue per user (ARPU), and LTV/CAC ratio. In one experiment, adding a low-priced trial increased conversion by 60% and, crucially, improved LTV by onboarding more users into premium features earlier.
| Cohort | Conversion (%) | ARPU | LTV | LTV/CAC |
|---|---|---|---|---|
| Organic | 4.5% | $8 | $120 | 6.0 |
| Paid Search | 6.0% | $12 | $150 | 2.5 |
| Referral | 9.0% | $10 | $180 | 9.0 |
| Social | 2.0% | $5 | $60 | 1.2 |
| Partner | 11.0% | $15 | $210 | 10.5 |
Referral tactic: provide a one-click invite with pre-written message and a clear reward for both sides; track invites-per-active-user and invite conversion to quantify viral lift.
To wrap up, the AARRR framework gives you a practical map to move from raw traffic to sustainable revenue and viral growth. Start by instrumenting one activation event and the top acquisition sources, then run small experiments that optimize each AARRR stage iteratively. Use cohort analysis, simple SQL joins, and lightweight Python models to identify leading indicators and prioritize work that increases LTV/CAC. Your next step: pick one channel, reduce friction in the activation flow, and measure the impact on 30-day retention—repeat this loop every two weeks. The AARRR framework will keep your growth work focused, measurable, and scalable as your product and team grow.

Analytics · 18 Nov 2024
Join me as I share my journey with the AARRR framework for business growth and discover how this simple model transformed my approach to success and engagement.

Analytics · 18 Nov 2024
Discover how I harness AARRR metrics to fuel my business growth and transform insights into action just like turning a seed into a thriving plant.

Analytics · 18 Nov 2024
Discover how I transformed my business using the AARRR funnel, turning curious visitors into loyal customers through simple strategies and real-life lessons.

Analytics · 15 Jul 2025
Pelajari analytics framework penting untuk data analytics agar keputusan bisnismu tepat dan efektif.

Analytics · 15 Nov 2024
Unlock the secrets of product performance analytics to drive smarter decisions and boost growth. Discover how data transforms insights into real-world success stories.

Google Analytics · 20 Sep 2024
Discover effective Google Analytics 4 strategies to enhance your data analysis and drive better business decisions with actionable insights.

Analytics · 15 Nov 2024
Discover how SaaS product analytics can transform data into growth opportunities, empowering businesses to make smarter decisions and boost user engagement.

Analytics · 09 Nov 2024
Unlock my data analyst career by mastering essential skills and understanding the job requirements that make me stand out in this dynamic field.

Analytics · 08 Nov 2024
Discover the essential data analysis framework to master data analysis fundamentals and enhance your decision-making skills for impactful insights

Product Management · 20 Sep 2024
Discover the Scrum method a powerful agile framework that enhances team collaboration productivity and project management for successful outcomes